Sunday, March 29, 2015

AP MACRO-VIDEOS

AP MACRO. UNIT 4 PART 1: Money Market Basic Concept
There are basically three types of money which are commodity money, representative money, and fiat money. These money functions as a medium of exchange, store of value, and unit of account. We also have to look at the things we purchase. Sometimes, we believe that the most expensive items has a better quality, which is actually false. 

AP MACRO. UNIT 4 PART 3: Money Market Graph
On a money market graph, the price that is paid for money is the interest rate which is the vertical axis of your graph while the quantity of money is the horizontal graph. In this graph, the demand of of money is sloping down, because when the price is high the quantity demanded is lower. When the price is low the quantity demanded is high, which is basically the law of demand. Also supply of money are fixed rate by the fed which is why it is vertical. 

AP MACRO. UNIT 4 PART 4: The Fed's Tools of Monetary Policy
Two of these tools is expansionary which is also easy money and contractionary which is tight money. When banks lower required reserves, this creates excess reserves. The banks can then use these extra reserves for loans, and when they want to contract the money then they would raise the required reserve. Then there are discount rate which are rate that the banks can borrow from the Fed. To expand the money supply the Fed buys the bonds, and when the Fed wants to reduce the supply of money then they would sell bonds. 

AP MACRO. UNIT 4 PART 7: The Loanable Funds Market
The loanable funds market are money that avaible to be loaned to people. In this graph, supply of money comes from the money people have in the bank. So it is dependent on savings. When people save more, there is a more loanable money to people, business, etc. On a money market, a shift to the right means the government is on deficit demanding more money. We can show this on a loanable graph by increasing the demand of loanable funds. 

AP MACRO. UNIT 4 PART 8: Money Creation and Multiple Deposit Expansion 
In this video, banks create money by making loans. When a customer makes a deposit into his account at a bank, this creates a liability for the bank. The money multiplier is basically one over the required reserve. This can then help you find the total money created. 

AP MACRO. UNIT 4 PART 9: Relating the Money Market, Loanable Funds Market, and AD-AS
When drawing graphs, always have the graphs correctly labeled. When someone buys securities from the government, you are basically loaning your money to them. In the money market, when government borrows money then there would be an increase in the money demanded. Also when demand increases in each graph, then it will shift to the right. The Fisher states that the real interest rate equals the nominal interest rate minus the expected inflation rate.


The Loanable Funds Market

-The market where savers and borrowers exchange funds (Qlf) at the real rate of interest (r%)
-The demand for loanable funds is in fact the supply of bonds
-The Supply of loanable funds, or savings comes from households, firms, gov't and the foreign sector. The supply of loanable funs is also the demand of bonds. 

Changes in the demand for loanable funds
-remember that demand for loanable funds=borrowing (i.e.supplying bonds)
-more borrowing=demand for loanable funds (-->)
-less borrowing=less demand for loanable funds (<--)
Examples: Government deficit spending=more borrowing=more demand for loanable funds. Dlf--->r%^ 
Less investment demand=less borrowing=less demand fore loanable demand

Changes in the supply of Loanable Funds
-Remember that supply of loanable funds=saving (i.e. demand for bonds)
-more saving=more supply of loanable funds (-->)
-less saving=less supple of loanable funds (<--)
Examples: Gov't budges surplus=more saving=more supply of loanable funds Slf-->r%(arrow down)
Increase in consumer's MPS=less saving=less supply of loanable funds Slf-->r% (arrow up)

Final Thoughts
-Loanable Funds market determines the real interest rate (r%)
-Loanable funds market relates saving and borrowing.


-Changes ins saving and borrowing creat changes in loanable funds and therefore the r% changes 

Creating a Bank

 Transaction #1: 
-Vault Cash: cash held by the bank
Transaction #2
-Acquiring property and equipment
Transaction #3
-Commercial Bank Functions: Accepting Deposits and Making Loans
Transaction #4
-Depositing reserves in a federal reserve bank: required reserves and reserve ratio
reserve ratio 

Excess Reserves=actual reserves-required reserves
required reserves=checkable deposits x reserve ratio

March 4, 2015

Time Value of Money 
A dollar today today worth more than a dollar tomorrow because of inflation and opportunity cost.

V=future value of $
P=present value of $
R=real interest rate (nominal rate-inflation rate) expressed as decimal
n=years
k=number of times interest is credited per yr

Simple interest formula
v=(1+r)^n x p

The compound Interest formula
v=(1+r/k)^nk x p 

The Monetary Equation of Exchange
MV=PQ
M=money supply (M1 or M2)
V=Money's Velocity (M1 or M2)
P=Price Level (PL on the AS/AD diagram)
Q=real GDP (sometimes labeled Y on the AS/AD diagram) 

Function of the FED
1. It issues paper currency
2. Sets reserve requirements and holds reserves of banks
3. It lends money to baks and charges them interest
4. They are a check clearing service for banks
5. Supervises member banks
6. Controls the money supple in the economy

March 3, 2015

Economics Notes

 Money-is any asset that can be used to purchase goods and services
3 uses: a medium of exchange (using it to determine value), unit of account (used to compare prices), store of value (where u put your money)
3 types of money: 1. commodity money (has value within itself) salt, olive oil, gold
2. representative money (represents something of value) IOU 3. fiat money (it is money because the gov't said so) paper currency & coins
6 characteristics of money: 1. durability (how long it'll last) 2. portability (you can take it anywhere) 3.divisibility (it can be divided) 4. uniformity (its the same) 5. limited supply 6.acceptability
money supply: it is the total value of financial asset available in the US economy

M1: -Liquid Asset (easily to convert to cash) ex: coins, paper currency, checkable deposit or demand deposits, traveler's check
M2: -(M1+Savings Account+Money Market Account)

3 purposes of financial institutions: 1. to store money 2. save money 3. loan money 

2 reasons why they loan money: 1. credit cards 2. mortgages
4 ways to save: 1. saving account 2. checking account 3. money market account 4.certificate of deposit 

Loans- banks operate on a fractional reserve system which means they keep a fraction of the funds and they loan out the rest

Interest Rates: Principal and Interest
principal: amount of money borrowed
interest: price paid for the use of borrowed money
simple interest: paid on the principal (I=PxRxT)/100 
T(time)=Ix100/PxR     P(principal)=Ix100/RxT    R(interest rate)=Ix100/PxT
compound interest: paid on the principal plus the accumulated interest

5 types of financial institution: 1.commercial bank 2.savings and loans institution 3.mutual savings banks 4. credit union 5. finance companies

Investment- we're redirecting resources. you would consume now for the future
financial asset- claim on property and income of borrower 

financial intermediary- institution that channel fund from savers to borrowers 
3 purposes: 1. to share risk through diversification (spreading out investment to reduce risk) 2. provide information 3. liquidity (returns)- this is the money the investor receives above and beyond the sum of money initially invested (the higher the risk, the higher return) 

Bonds you loan, Stocks you own
Bonds- are loans or IOUs that represent debt that the gov't or a corp. must repay to a investor (generally low risk investment) 
3 components: 1. coupon rate: it is the interest rate that a bond issuer will pay to a bond holder 2. maturity: time at which payment to a bond holder is dues 3. par value: the principal the amount the investor pays to purchase a bond

Yield: the annual rate of return of a bond if the bond was held to maturity

Monday, March 2, 2015

Notes Continued

-What is Investment? Money spent or expenditures on:
  • New Plants (factories)
  • Capital Equipment (machinery)
  • Technology (hardware & software)
  • New Homes
  • Inventories (goods sold by producers)
-Expected Rates of Return? 
  *How does business make investment decision? Cost/Benefit Analysis 
  *How does business determine the benefits? Expected rate of return
  *How does business count the cost? Interest Cost
  *How does business determine the amount of investment they undertake?
    -compare expected rate of return to interest cost
    -if expected return>interest cost, then invest
    -if expected return<interest cost, then invest

Real (r%) v. Nominal (i%): What is the difference?
-Nominal is the observable rate of interest. Real subtracts out of inflation (π%) and is known as ex post facto.
*How do you compute the real interest rate? r% = i% - π% 
*The real interest rate determines the cost of an investment decision.

The Investment Demand Curve (ID) is downward sloping; because when interest rates are high, fewer investments are profitable. When interest rates are low, more investments are profitable. 


Determinants of SRAS

Input Prices-Domestic Resources
Wages-(75% of all business cost): cost of capital
___________________________________________________________________________

Raw Materials Commodity Prices:

  • Foreign Resource Prices
  1. Strong $ = lower foreign prices
  2. Weak $ = higher foreign resource prices
  • Market Power: Monopolies and Cartels that control resources, control the price of those resources
  1. Increase in Resource Prices=SRAS <----
  2. Decrease in Resource Prices=SRAS ---->
Productivity: (total output/total inputs)
  • More productivity = lower unit production cost (SRAS ---->)
  • Lower Productivity = higher unit production cost (SRAS <---)
Legal- Institutional Environment:
  • Taxes and Subsidies - Taxes ( $ to gov't) on business increases per unit production cost (SRAS <---)
  • Subsidies- ($ from gov't) to business reduce per unit production cost (SRAS --->)

Long-Run vs. Short-Run

Long-Run: Period of time where input prices are completely flexible.
Long-Run Aggregated Supply (LRAS): This marks the level of full employment in the economy. (analogous to PPC)

  • Because input prices are completely flexible in the long-run, changes in price level do not change the firms' real profits and therefore do not change firms' level of out. This means that the LRAS is vertical at the economy's level of full employment.
  • Per-Unit Production Cost=Total Input Cost/Total Output     
Short-Run: It is the concept that within a certain period of time, in the future, at least one input is fixed while others are variable. 
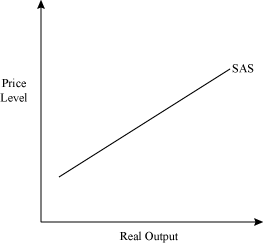
Short-Run Aggregated Supply (SRAS): shows total planned output when prices in the economy can change but the prices and productivity of all factor inputs e.g. wage rates and the state of technology are held constant. 
  • Because input prices are sticky in the short-run, the SRAS is upward sloping.
  • An increase in SRAS is seen as a shift to the right. A decrease will shift it left.